
Why driving is the riskiest part of a field service technician's day
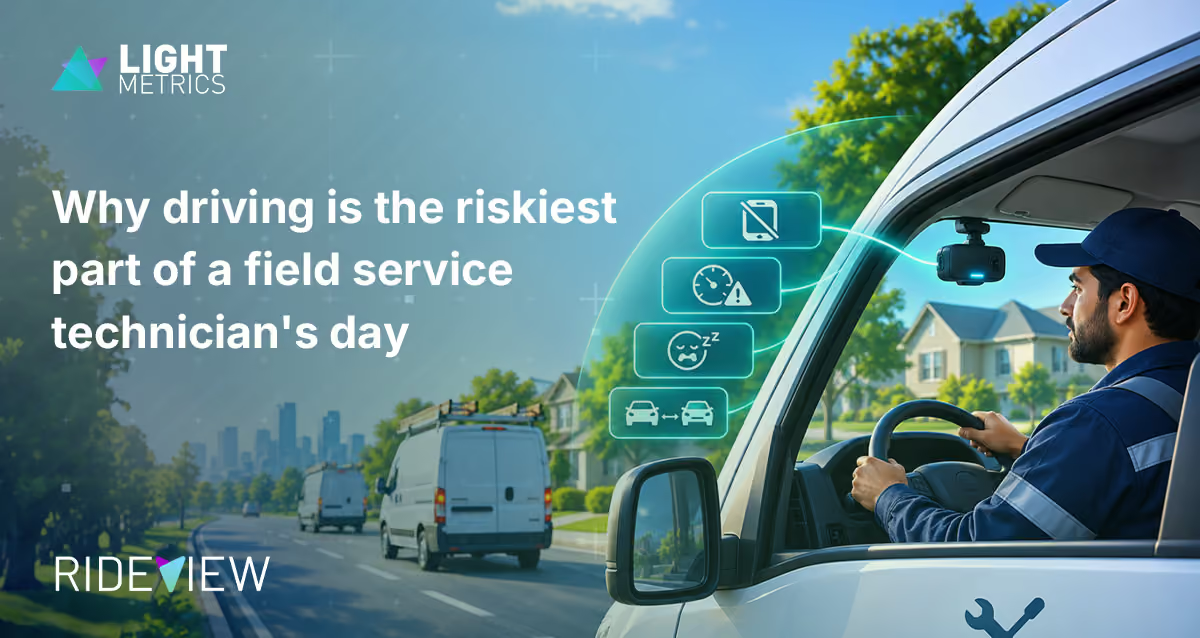
Technicians spend hours on the road between jobs, often under time pressure. Covers road risk in field service and how real-time in-cab alerts protect distributed teams.
Share


Why driving is the riskiest part of a field service technician's day
The most dangerous thing most field service technicians do all day is drive between jobs. Transportation incidents claimed 1,937 lives at work in the United States in 2024, more than any other type of workplace event, and a technician repeats that exposure with every service call on the schedule. Field service fleet safety therefore begins on the road, not at the job site.
That ranking surprises many service leaders. Safety programs in field service tend to concentrate on site hazards such as electrical work, ladders and confined spaces, which are visible, regulated and well documented. The drive that connects those jobs receives far less attention, even though it fills a large share of every technician's day.
Why is driving the biggest risk in field service work?
The numbers give a clear answer. The US Bureau of Labor Statistics recorded 5,070 fatal work injuries in 2024, and transportation incidents accounted for 1,937 of them, or 38.2 percent, which makes them the most frequent fatal work event by a wide margin. Roadway crashes involving motor vehicles made up 1,146 of those deaths on their own.
Exposure explains why field service sits squarely inside that statistic. A technician might visit five to ten sites in a day, which means five to ten separate trips through urban traffic, residential streets, parking lots and unfamiliar addresses. Each leg is short, the pressure to reach the next arrival window is constant, and job details keep arriving on a phone that sits within reach.
The takeaway: road risk in field service scales with every stop added to the schedule.
What makes technician driving different from other fleet driving
Long haul carriers worry about fatigue on monotonous highways, while field service risk looks very different. The patterns below show up consistently across HVAC, plumbing, electrical, telecom and appliance repair fleets. Together they explain why a standard fleet safety checklist rarely fits a service operation.
- Many short trips. Five to ten stops a day mean constant merging, turning and parking in tight spaces, where low speed collisions and backing incidents are common.
- Schedule pressure. Tight arrival windows reward making up time between jobs, and speeding or rolling stops are the usual shortcuts.
- Distraction built into the work. The phone runs navigation, dispatch updates and customer calls, so the strongest source of distraction is also a work tool.
- Hired for trade skills first. Technicians are recruited as electricians, plumbers or engineers, and their driving history often goes unexamined at hiring.
What a single crash costs a field service business
The Network of Employers for Traffic Safety puts the average cost of an on-the-job crash at close to $56,000, within a total burden on US employers of roughly $62 billion a year across health benefits, sick leave, liability, vehicle damage and lost productivity. Those figures come from the 2026 edition of its employer cost report, so they reflect current claim and repair economics. A single serious injury crash can run far higher once litigation enters the picture.
Service businesses also carry costs that never appear on the claim. A van in the body shop means cancelled appointments and missed service level commitments, an injured technician means lost billable hours for weeks, and a branded vehicle in a crash photo circulates in exactly the neighborhoods where the company works. For example, a regional HVAC fleet that loses one van and one technician for a month forfeits a full route of revenue while still carrying the payroll and insurance costs.
How real-time alerts improve field service fleet safety
Video telematics pairs road- and driver-facing cameras with AI that recognizes risky moments as they form. RideView, our video safety platform, runs that AI directly on the camera and gives the technician an instant voice alert the moment it detects phone use, drowsiness, tailgating or speeding. The correction happens in the cab within seconds, long before a manager could ever review footage.
After the drive, a cloud layer revalidates every event and ranks it by severity, so supervisors see verified risks rather than a pile of false alarms. Driver scores make coaching consistent across employed and contracted technicians, and the same data recognizes safe driving as readily as it flags risk. Fleets using RideView have cut distracted driving by up to 70 percent and speeding by up to 50 percent.
Privacy is handled by design, which matters for technician acceptance. Video is processed on the device and only short event clips upload, so nobody is streaming a technician's entire day. RideView also connects through APIs and single sign on, which places video alongside the dispatch and routing tools a service operation already runs. You can see how this fits your operation on our video telematics for field service fleets page.
What video safety will and will not fix
Cameras address the driving, and only the driving. An overbooked schedule that forces technicians to rush is a dispatch problem, and no alert can compensate for a route plan that requires speeding to stay on time. Job site hazards such as electrical work and falls sit outside the reach of any vehicle system and still need their own program.
Results also depend on what managers do with the data. Alerts change behavior quickly, yet the fleets that sustain improvement pair them with regular coaching conversations and recognition for safe drivers. Expect meaningful movement in scores over the first few months rather than overnight.
Field service fleet safety FAQ
Is driving more dangerous than the work technicians do on site?
By fatality data, yes. Transportation incidents were the most frequent fatal work event in the United States in 2024 at 38.2 percent of deaths, well ahead of falls and contact with equipment. Site hazards remain serious, and driving simply deserves the same rigor because it recurs many times each day.
Do dash cams feel invasive to technicians?
Acceptance depends on how the system works and how it is introduced. With on-device processing, footage stays on the camera and only brief event clips upload, so there is no live feed of a technician's day. Clear policies, plus the protection video provides in disputed accidents, tend to turn skeptics into supporters within weeks.
What does a video safety program cost for a field service fleet?
Modern platforms run full AI on affordable commodity cameras with no dedicated GPU, priced as a monthly per vehicle subscription through your telematics provider. Set that against an average on-the-job crash cost of close to $56,000 and the program typically pays for itself by preventing a single incident. Exact pricing depends on camera choice, fleet size and the features you enable.
See what your fleet's riskiest hours look like
Count the trips your technicians made last week, then consider how many of those miles had any safety coverage at all. We built RideView to protect exactly that part of the workday, delivered on affordable cameras and inside the telematics tools your operation already runs. Request a demo at lightmetrics.co.
Latest in fleet safety.
Why Insurance Leaders Are Betting on Video Telematics to Transform Fleet Risk
Why Insurance Leaders Are Betting on Video Telematics to Transform Fleet Risk
Why Insurance Leaders Are Betting on Video Telematics to Transform Fleet Risk
Get in touch with us.
If you want to learn more or want to consider offering RideView to your fleet customers, Please reach out.